Antenna Range for Watching Planes
One of the things I've been doing lately with the airplane data I'm collection with my RTL SDR is come up with better estimates for how much coverage and range I get in my local area. While you can easily estimate range just by watching dump1090's map output, you really have to look at a whole day's worth of data or more to get a good idea of what you can see. It's also useful to come up with some numerical estimates of the coverage so you can compare one hardware setup to another. After dusting off geometric algorithms, I realized the right thing to do was clean the data a bit and then compute the area of a convex hull for the points. The SciPy spatial library for Python has a ConvexHull that makes this easy to do.
Computing the Convex Hull
My airplane data is just a collection of geospatial points collected each day, so a good way to quantify my range would be to find a bounding shape for the points and compute the area. A bounding rectangle would be quick and easy, but inaccurate. I started thinking about algorithms to rotate a rectangle for a better fit, or recursively remove sections of it until it gave better coverage. Realizing that I was reinventing the wheel, I searched around for known solutions. A s/o answer pointed me to the gift wrapping algorithm, which builds a bounding polygon by comparing all remaining points and selecting the one that would maximize the new interior angle. It looked like it'd be fun to code up, but expensive to compute.
I then stumbled onto a youtube video that explained how QuickHull selected the four (left,right,up,down)-most points to build two triangles, removed all the interior points, and then selected points that would add the largest triangle to the polygon (or remove the most points). I was looking forward to coding this up, but once again, I wondered what was already available. Naturally, you can already do this in python: SciPy's Spatial library has ConvexHull. It's as easy as:
from scipy.spatial import ConvexHull
import matplotlib.pyplot as plt

# Do something to get some 2D points

# Let Convex hull do the work
cv = ConvexHull(pts)

#cv.vertices has the bounding polygon

print("%f\n" % cv.area) # Get some stats
Sigh.. Python's great, but it sure does take the fun out of everything.
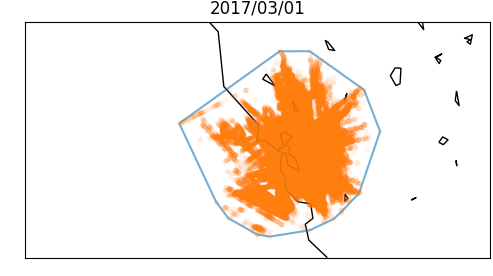
Generating Plots
There was stil a good bit of other cleanup and map stuff I had to do to start making reasonable pictures. First, I had to throw out some bad data. I still get a lot of bad points, most likely because of transmission errors (or misconfigured transmitters?). I filtered everything out that's outside of a reasonable range (though this was tighter than it needed to be). The number of bad points in any day was 1.2% of the observed points (50% of the days had less than 0.01% bad data). For plotting I had to load in Basemap and do all the normal merc projection stuff. For something so fundamental, this always seems to take a lot longer than it should. In any case, the pictures look good when you finish.