Examining Bad Flight Data from the Logger
One of the problems of capturing your own ADS-B airplane data is that there are always bad values mixed in with the good. As I started looking through my data, I realized that every so often there'd be lon/lats that were nowhere near my location. Initially I thought I might be getting lucky with ionospheric reflections. However, a closer look into where these points are shows something else is probably going on here.
I wrote some Pylab to take all of my points and plot them on a world map (well, without the actual map). I marked of a rectangular to bound where Livermore is and then plotted each point I received. The points were colored blue if they were within the Livermore area and red if they were outside of it. I then extended the lon/lat boundaries for the Livermore area to help see where the far away points were relative to Livermore's lon/lat box.
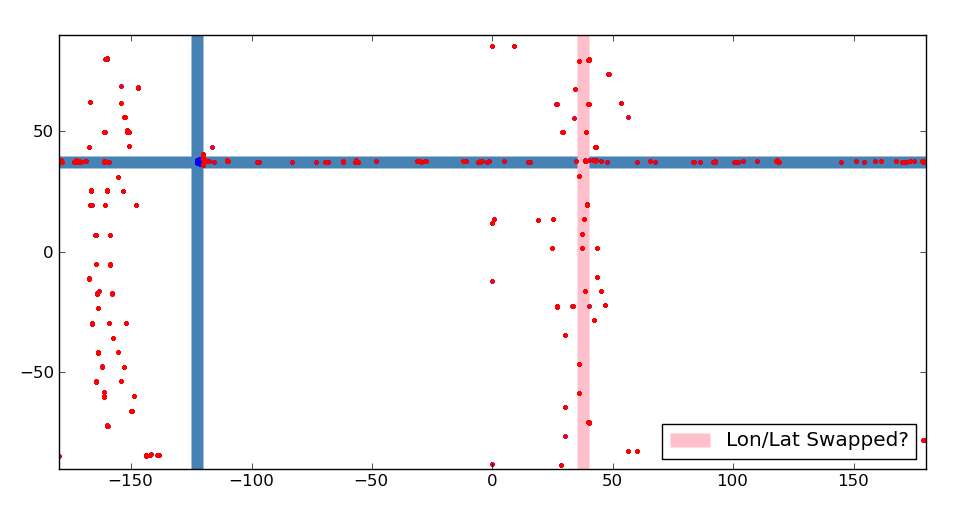
The first thing I noticed was that there were a whole slew of dots horizontally that fall within Livermore's lat range. It's possible that this could be due to bit errors in the lon field. The next thing I noticed was that there were two columns of bad points, one at about -160 degrees, the other around 35. Since both of these columns had data spread across all lats, I realized it probably wasn't from an ionospheric reflection. The right column happens to be at about the same value as you'd get if lon and lat were swapped (drawn as a pink bar). However, I don't think that's what happened, as the dots are distributed all the way across the vertical column.
Individual Offenders
Since I didn't have a good explanation for the bad values, I did some more work on the dataset to pull out the individual offenders. Of the 2092 unique planes, only 16 were giving me problems. I plotted each plane's points individually below using the same plotter as before.

To me, these breakdowns indicate that the problem planes exhibit a few types of bad data. Three of them have purely horizontal data, while about 12 of the rest have some vertical problem. The 8678C0 case doesn't have enough points to tell what it's thinking. Interestingly, the vertical cases all seem to have at least a few points near Livermore. This makes me wonder if their GPS lost sync at some point in the flight and started reporting partially incorrect data. In any case there seem to be some common failure patterns.
Plane Info
Out of curiosity I went and looked up all 16 of these flights by hand to see what they were. It's interesting that all three of the planes with horizontal errors were't small planes (one old 747 and two new 777's). All the vertical errors seem to be from smaller planes (though one was a US Airways express). Here's the run down, including the number of days that I saw a particular plane in February:
#ID    Days Flight  Info
4248D9 1    VQ-BMS  Private 747 (1979) Las Vegas Sands Corp
8678C0 1    JA715A  Nippon Airways 777
868EC0 1    JA779A  Nippon Airways 777
A23C2E 4    N243LR  USAirways Express
A3286B 1    N302TB  Private Beechcraft 400xp
A346D0 1    N310    Private Gulfstream
A40C4B 2    N360    Private (San Francisco)
A5E921 7    N480FL  Private Beechcraft
A7D68B 1    N604EM  Private Bombadeer
A7E28D 1    N607PH  Private Post Foods Inc
A8053D 1    N616CC  Private Gulfstream
A8DAB9 1    N67PW   Private Falcon50
AA7238 7    N772UA  United Airlines 777
AC6316 1    N898AK  Private Red Line Air
AC70DC 2    N900TG  Private (Foster City)
AD853E 2    N970SJ  Private Gulfstream
Code and Data
I've put my data and code up on GitHub for anyone that wants to look at it.
github:livermore-arplane-tracks