Flight Data From the Data Logger
Now that I've been running the Edison airplane data logger for more than a month, it's time to start looking at the data it's been capturing. I pulled the logs off the sdcard, reorganized them into tracks, and then generated daily plots using Mapnik. The below image shows all of the flights the logger captured for each day in February.

The first thing to notice is that the SDR has a pretty good range, even with the stock antenna. I live just south east of the dot for Livermore and was only expecting to see planes near town. Instead I'm seeing traffic all over the Tri-Valley and some a little bit beyond. I was initially surprised to see anything in either the Bay area or the central valley because of the Pleasanton ridge and the Altamont hills. However, I realized it makes sense though- planes fly much higher than the hills, except when they're landing.
Logger Statistics
I wanted to know more about the data I was getting so I wrote a few scripts to extract some statistics. The first thing I wanted to know was what percentage of the time the logger was running each day. I made a decision not to run it all day when I started because there just aren't that many flights at night. In order to help me remember to start and stop the logger each day, I plugged the Edison into the same power strip my home router uses, which I usually turn on when I get up (7am) and turn off when I go to bed (11:30pm). I wrote a perl script to look through each day's log and find the largest gap of time where there was no data. Since the logger uses UTC, my nightly shutdowns usually appear as a 7 hour gap starting around 7am UTC. The top plot below shows what percentage of the day the logger was up and running. It looks like I was only late turning it on a few times in February.
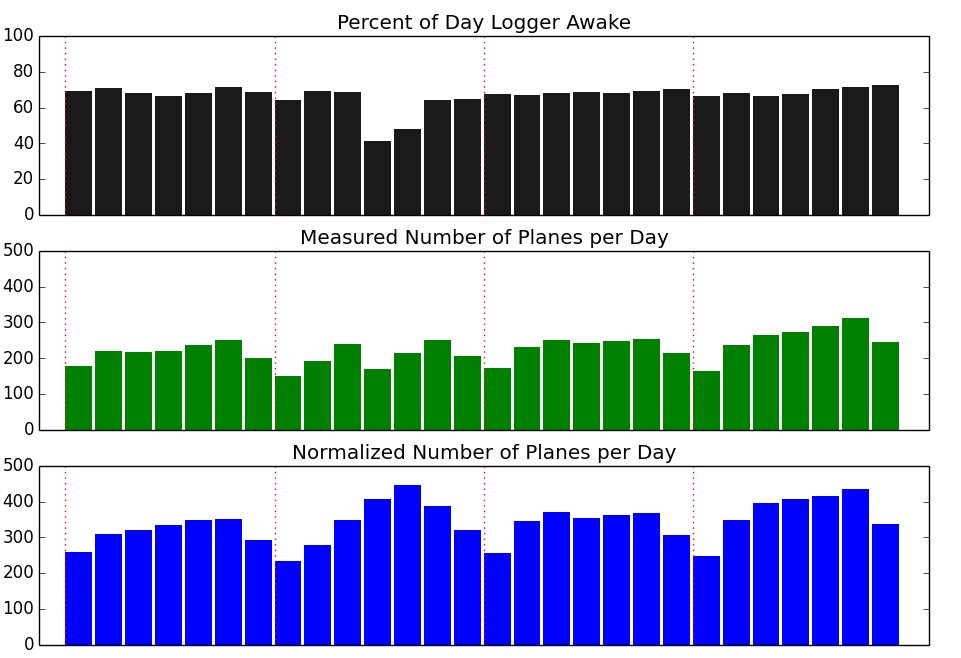
The next thing I wanted to know was how many flights I was seeing a day. The raw numbers are in green above, but I've also scaled them up using the top chart's data to help normalize it (no, not a fair comparison, as night flights are fewer). The red lines on the plots indicate where Sundays began on these plots. It looks like there's definitely lighter activity on Sundays. Things are a little skewed though, since everything is in UTC instead of Pacific (I was lazy and didn't bother to redistribute the days).
Missing IDs
The logger looks for two types of ADS-B messages from dump1090. The first is an occasional ID message that associates the hex ID for a plane with its call sign (often a tail fin). The second is the current location for a particular plane (which only contains the hex ID). Grepping through the data, I see 2195 unique hex IDs for the position messages, but only 2092 unique hex IDs for the ID messages. I checked and both message streams have some unique values that do not appear in the other message stream.
What Airlines am I Seeing?
Another stat I was interested in is what airlines show up the most in my data. It isn't too hard to get a crude estimate of the breakdown because (most?) commercial airlines embed their ICAO code in their flight number. Through the power of awk, grep, sed, and uniq, I was able to pull out the number of different flights each provider had over my area (this is unique flight numbers, not total flights). Here are the top 20:
404 UAL  United Airlines
114 VRD  Virgin America
 84 FDX  Federal Express
 72 AAL  American Airlines
 51 DAL  Delta Airlines
 46 JBU  Jet Blue
 45 SKW  Sky West
 38 AWE  US Airways
 29 EJA  Airborne Netjets Aviation ExecJet
 26 UPS  United Parcel Service
 22 RCH  Airborne Air Mobility Command "Reach"
 18 CPA  Cathway Pacific Aircraft
 17 OPT  Options
 16 EJM  Executive Jet Management "Jet Speed"
 11 TWY  Sunset Aviation, Twilight
 11 HAL  Hawaiian Airlines
 11 CSN  China Southern Airlines
 10 KAL  Korean Air
 10 EVA  EVA (Chinese)
  7 AAR  Asiana Airlines
There are a few things of interest in that breakdown. First, freight airlines like FedEx and UPS show up pretty high in the list. I think people often overlook them, but they occupy a sizable chunk of what's in the air. Second, I didn't see anything from Southwest in the data. They definitely fly over us, so I was surprised that I didn't see any SW or WN fins. Finally, there were a ton of planes that didn't have any info associated with them that would help me ID the owner (e.g., there were 456 N fins). There are websites you can go to to look them up (most of the time it just gives a private owner), but it's something that sinks a lot of time. Maybe later I'll revisit and write something to automate the retrieval.